Analysing General Election Voter Turnout
Another year, another election in the UK and this one is set to be a doozie. So much so, we’ve already seen a marked spike in voter registrations leading the BBC to publish this article about the influence of non-voters. This naturally leads to the question about how voter turnout has impacted previous elections so we can try and undertsand what the impact might be of an increased turnout in this one.
As it happens, UK Parliament releases all election data through their API and there is a great wrapper package hansard we can use to scrape the data the data from the 2015 and 2017 General Elections and try and conduct an analysis that can help us understand the impact of voter turnout. Let’s check out the data available…
library(hansard)
library(tidyverse)

#2015 election
election15 <- election_results(ID = 382386)
# 2017 election
election17 <- election_results(ID = 730039)

election_master <- rbind(election15, election17)
election_master <- election_master %>%
  mutate(turnout_pct = turnout / electorate) %>%
  separate(result_of_election, c("result_of_election", "swing"), sep = " ")
knitr::kable(head(election_master))| about | electorate | majority | result_of_election | swing | turnout | constituency_about | constituency_label_value | election_about | election_label_value | turnout_pct |
|---|---|---|---|---|---|---|---|---|---|---|
| 383000 | 71485 | 16890 | Con | Hold | 47257 | 146989 | Hereford and South Herefordshire | 382386 | 2015 General Election | 0.6610758 |
| 383130 | 73181 | 10709 | Con | Hold | 50010 | 147053 | Maidstone and The Weald | 382386 | 2015 General Election | 0.6833741 |
| 383181 | 48690 | 5325 | Con | Hold | 33757 | 147077 | Montgomeryshire | 382386 | 2015 General Election | 0.6933046 |
| 383413 | 76645 | 20761 | Con | Hold | 54559 | 147191 | Skipton and Ripon | 382386 | 2015 General Election | 0.7118403 |
| 383460 | 79285 | 17813 | Con | Hold | 51304 | 147214 | South West Bedfordshire | 382386 | 2015 General Election | 0.6470833 |
| 382769 | 74485 | 93 | Lab | Gain | 51161 | 146876 | City of Chester | 382386 | 2015 General Election | 0.6868631 |
Annoyingly, we don’t have the votes per candidate. Only the majority size. But we have been able to use the original result_of_election to seperate out whether the constituency was a hold or a gain and been able to calculate the percentage turnout. That should be enough to try and examine the imapct of voter turnout between elections and whether there’s a difference on the held v gained seats. First, let’s compare elections. (Note, I usually include the code for the charts but in this case, it’s the same simple structure as past post charts but with a lengthy scale_fill_manual call to define the party brand colours so I haven’t included for readabilties sake. Feel free to get in touch if you’d like to review the code though).
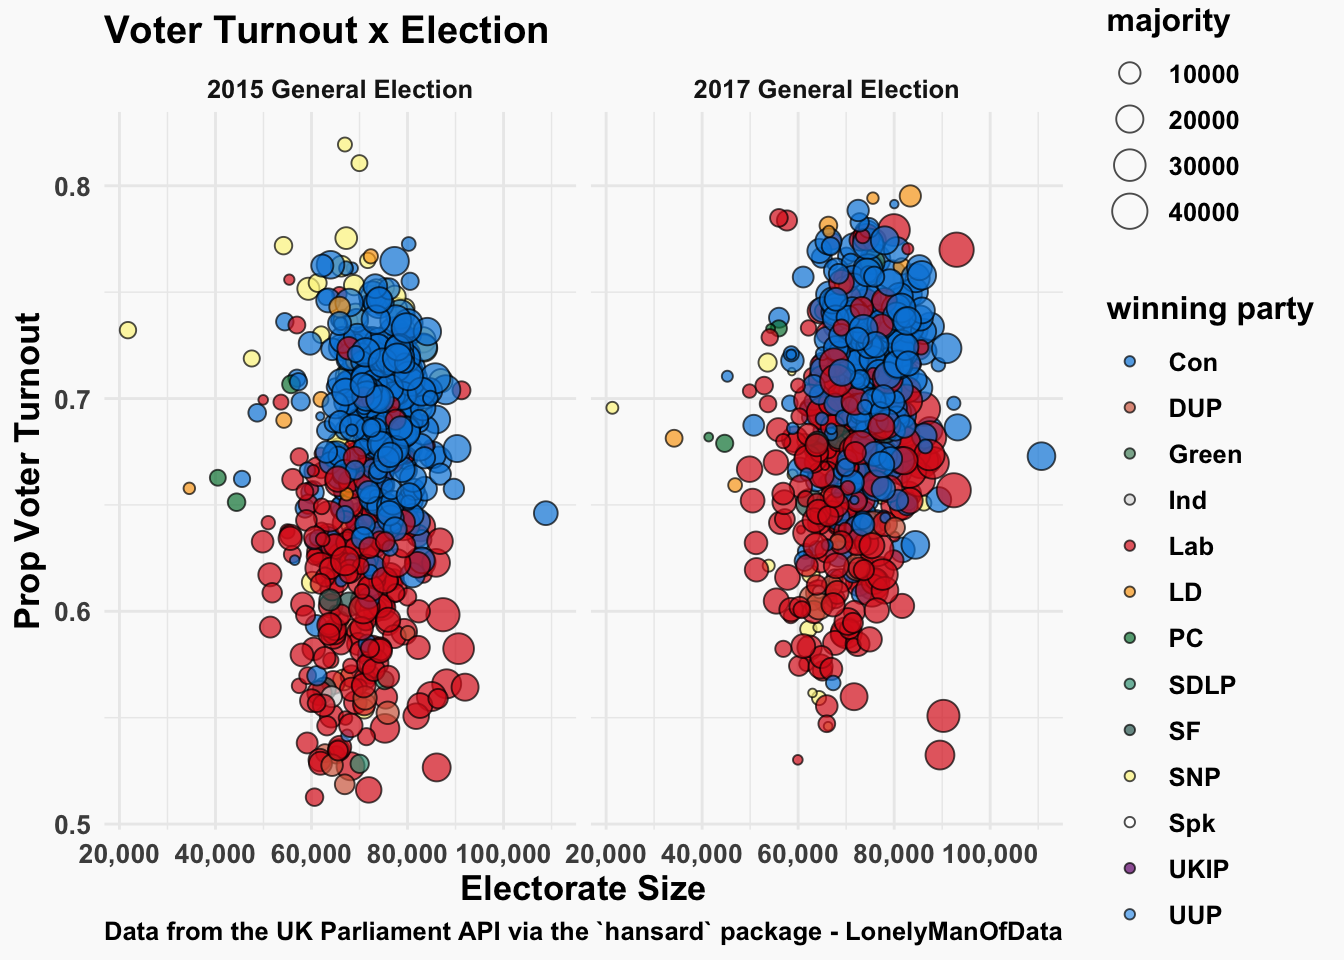
There’s a few things that standout here. Firstly, the proportional turnout in general is higher in the 2017 election, however there are some constituencies in 2015 with a fantastic voter turnout rate. These are all SNP wins, suggesting a call to arms around the Scottish Indyref. The second is that Conservative won seats tend to have a higher turnout rate than labour seats across the board. We can combine the years and check to see if there is any trend in held and gained seats that might explain this.
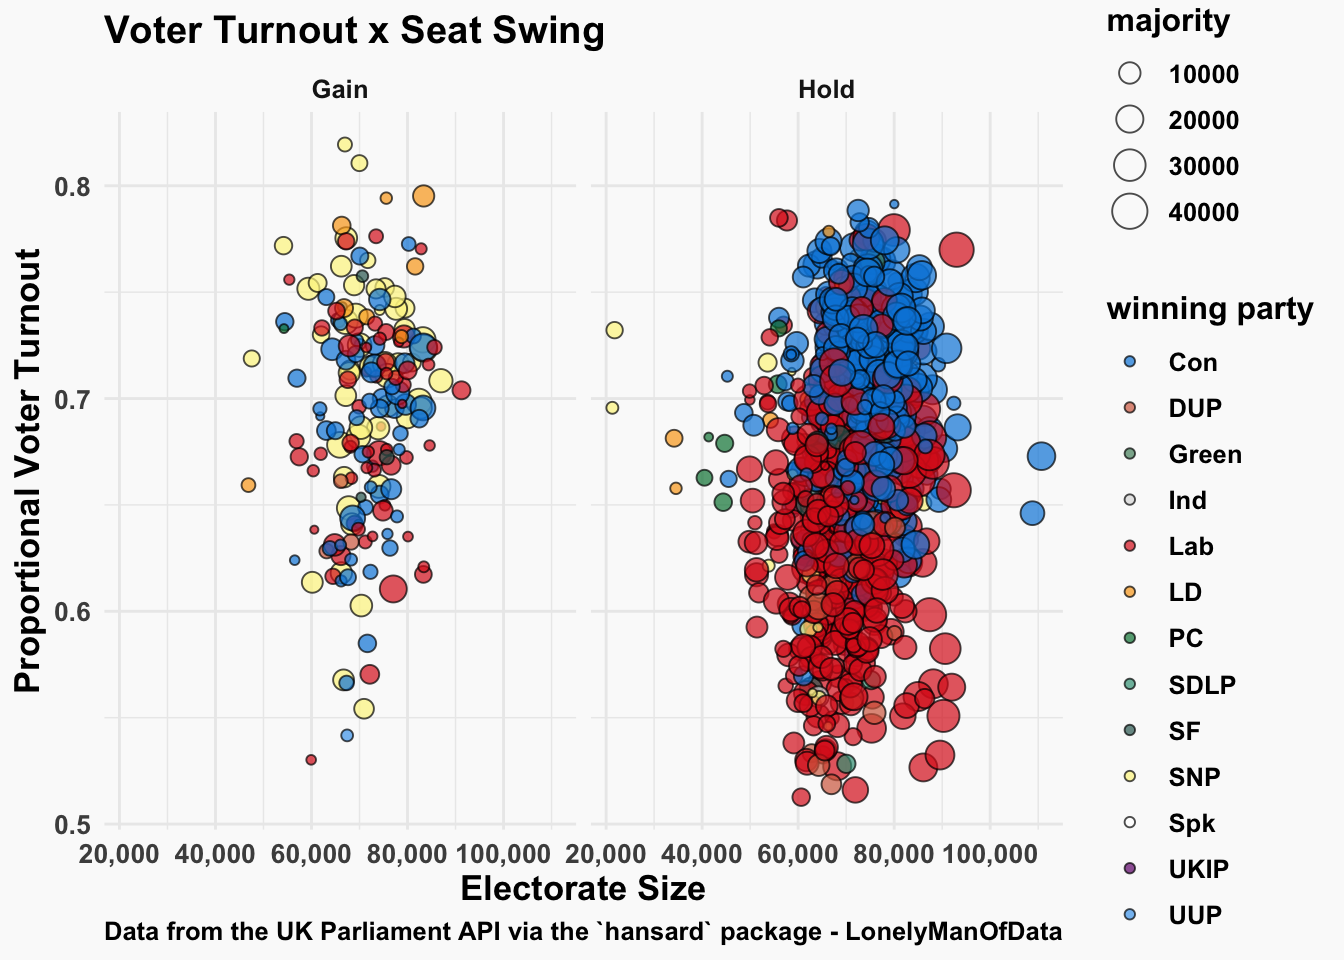
Again, a few things to digest here. First, the gained seats facet further supports the SNP rallying call the previous chart shows as well as highlighting the 2017 DUP seat gains more clearly. This could lead to the conclusion that the rallying of a party around a clear cause can have a big impact on voter turnout and subsequently, the result of the election in those constituencies.
Secondly, we see the same trend at an overall level that typically held Conservative seats see a greater voter turnout rate than Labour ones. The general consensus in the SHARE office was that this could highlight a difference in party voter base; with older people more likely to turnout and to vote right wing.
What does this tell us overall? People come out to vote when there is a clear cause to support and I’d say Brexit is a cause that people tend to be fairly passionate about. This can certainly help explain why we’ve seen a surge in voter registrations. What that surge may mean in terms of election result is less clear. Given the Brexit party aren’t running in Conservative strongholds, you’d expect the turnout proportion in those constituencies to remain largely the same the labour constituencies to perhaps see is a higher turnout by virtue of clear oppostion and a clearer cause themselves. It’s going to be an interesting election season for the pollsters, that’s for sure.